Last Updated: December 04 2023
Managing COVID-19 with Simpro Premium BI Reporting - Questions and Dashboards
Overview
Use BI Reporting to extract specific data from your Simpro Premium build so you can create your own customised reports, dashboards and data visualisations to make more informed business decisions.
Creating your own custom BI Reporting dashboards helps to easily monitor current trends on sales and costs in jobs and quotes, identify areas to focus on and potential workflows that can be optimised, and use this data to plan and adapt to the current economic climate.
BI Reporting pulls data from a saved copy of your database, ensuring that the processing of information is efficient even when retrieving thousands of records. Depending on when the BI Reporting is being used, information presented in the reports can be up to 24 hours old.
 Enable BI Reporting
To use BI Reporting, enable it in your security groups:
- Go to System
 > Setup > Security Groups.
 - Click the relevant security group.
- Click the Reports tab.
- Select the BI Reporting check box.
- Click Save and Finish.
 Create quote questions in BI Reporting
Before assembling the quote management dashboard, first create the following questions in BI Reporting.
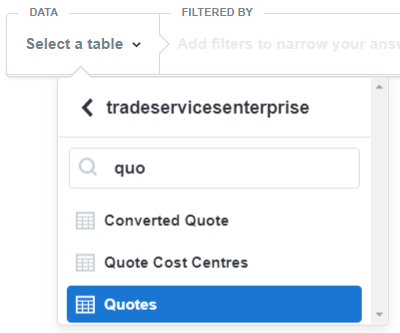
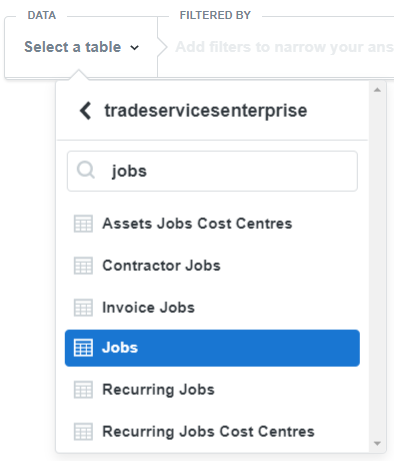
Start a new question
- Go to BI Reporting > Ask a question.
- On the New question page, click Select a table and choose Quotes.
Quotes created
- Start a new question.
- Under View, select Count of rows.
- Under Grouped By, select Date Created and then select Month.
- Click Get Answer to confirm the resulting data.
- Under Visualization, select Smart Number.
- Click Save and rename the question.
Estimated quote net margin
- Start a new question.
- Under View, select Sum of Estimated Net Margin.
- Under Grouped By, select Date Created and then select Month.
- Click Get Answer to confirm the resulting data.
- Under Visualization, select Smart Number.
- Click Save and rename the question.
Pipeline of quote stages
- Start a new question.
- Under Filtered By, click the add icon and under Quote select Status.
- Select the operator Is and select the required statuses.
- Click Add Filter.
- Under View, select Count of rows.
- Under Grouped By, select Stage.
- Click Get Answer to confirm the resulting data.
- Under Visualization, select Funnel.
- Click Save and rename the question.
Quote status
- Start a new question.
- Under View, select Count of rows.
- Under Grouped By, select Status.
- Click Get Answer to confirm the resulting data.
- Under Visualization, select Pie.
- Click Save and rename the question.
Forecasted hours for quotes over 70% probability
- Start a new question.
- Under View, select Sum of Estimated Labour Hours.
- Under Grouped By, select Date Due Expected and then select Month.
- Click Get Answer to confirm the resulting data.
- Under Visualization, select Area.
- Click Save and rename the question.
 Create job questions in BI Reporting
Before assembling the job management dashboard, first create the following questions in BI Reporting.
 Project jobs total
- Start a new question.
- Under Filtered By, click the add icon and under Job select Type.
- Select the operator Is and select Project.
- Click Add Filter.
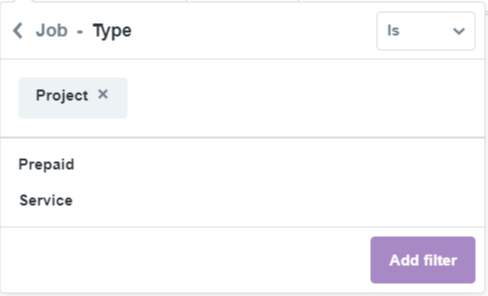
- Under View, select Sum of Total Price Inc Tax.
- Click Get Answer to confirm the resulting data.
- Under Visualization, select Gauge.
- Click Save and rename the question.
 Service jobs total
- Start a new question.
- Under Filtered By, click the add icon and under Job select Type.
- Select the operator Is and select Service.
- Click Add Filter.
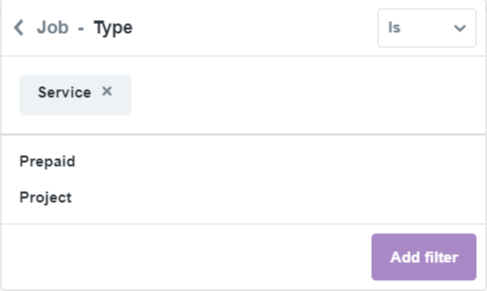
- Under View, select Sum of Total Price Inc Tax.
- Click Get Answer to confirm the resulting data.
- Under Visualization, select Gauge.
- Click Save and rename the question.
 Jobs created each month
- Start a new question.
- Under View, select Count of rows.
- Under Grouped By, select Date Created and then select Month.
- Click Get Answer to confirm the resulting data.
- Under Visualization, select Bar.
- Click Save and rename the question.
 Salesperson creating jobs
- Start a new question.
- Under Filtered By, click the add icon and under Job select Date Created.
- Select Current > Year.
- Click Add Filter.
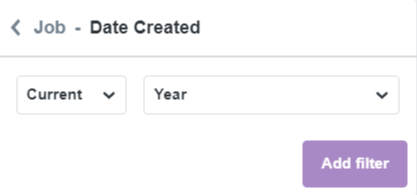
- Click the add icon and under Job select Salesperson.
- Select the operator Is and select the required salesperson.
- Click Add Filter.
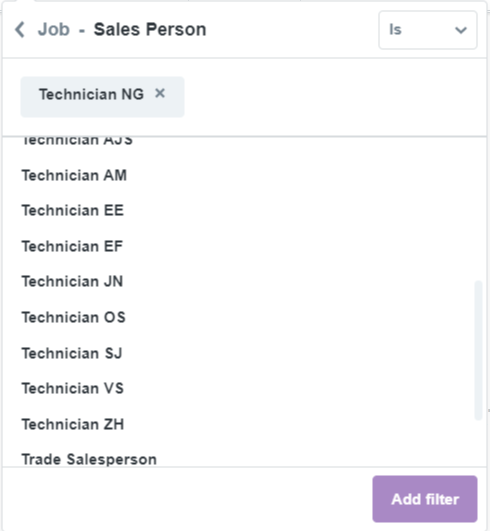
- Under View, select Count of rows.
- Click Get Answer to confirm the resulting data.
- Under Visualization, select Gauge.
- Click Save and rename the question.
Create a new question for each salesperson to be reported on.
 Jobs created by type
- Start a new question.
- Under View, select Count of rows.
- Under Grouped By, select Type.
- Click Get Answer to confirm the resulting data.
- Under Visualization, select Area.
- Click Save and rename the question.
 Labour hours forecast by month project due
- Start a new question.
- Under View, selectSum of Estimated Labour Hours.
- Under Grouped By, select Date Due and select Month.
- Click Get Answer to confirm the resulting data.
- Under Visualization, select Area.
- Click Save and rename the question.
 All completed jobs - Est Gross Margin vs Actual Gross Margin by Project Manager
- Start a new question.
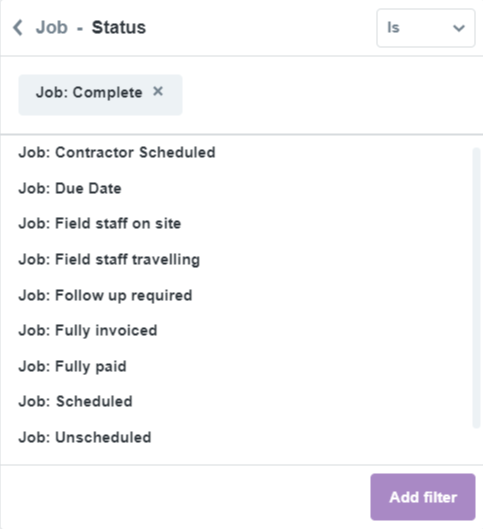
- Under Filtered By, click the add icon and under Job select Status.
- Select the operator Is and select your job completed status.
- Click Add Filter.
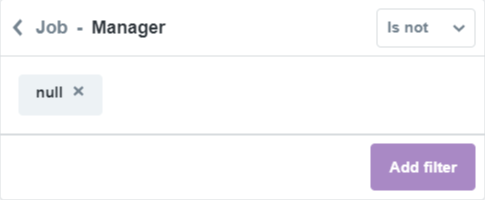
- Click the add icon and under Job select Manager.
- Select the operator Is Not and enter 'null'.
- Click Add Filter.
- Under View, select Average of Estimated Gross Margin.
- Click the plus icon under View and select Average of Actual Gross Margin.
- Under Grouped By, select Manager.
- Click Get Answer to confirm the resulting data.
- Under Visualization, select Bar.
- Click Save and rename the question.
 Assemble the quote and job dashboards
Now that all the questions are created, you can now assemble the BI Reporting dashboards. Add your saved questions to your dashboard and arrange them in a way that makes it easy to review and understand.
To create a new dashboard:
- Go to BI Reporting and click New dashboard.
- Click Create. This creates and displays the new dashboard page.
- On the selected dashboard page, click the icon to Add a question.
- Navigate to and click the required collection. Select a question from the list to add it to the Dashboard.
- Continue adding questions to the dashboard using the Add a question icon.
- Position the questions on the dashboard by clicking and dragging.
- Click Save once the dashboard is complete.
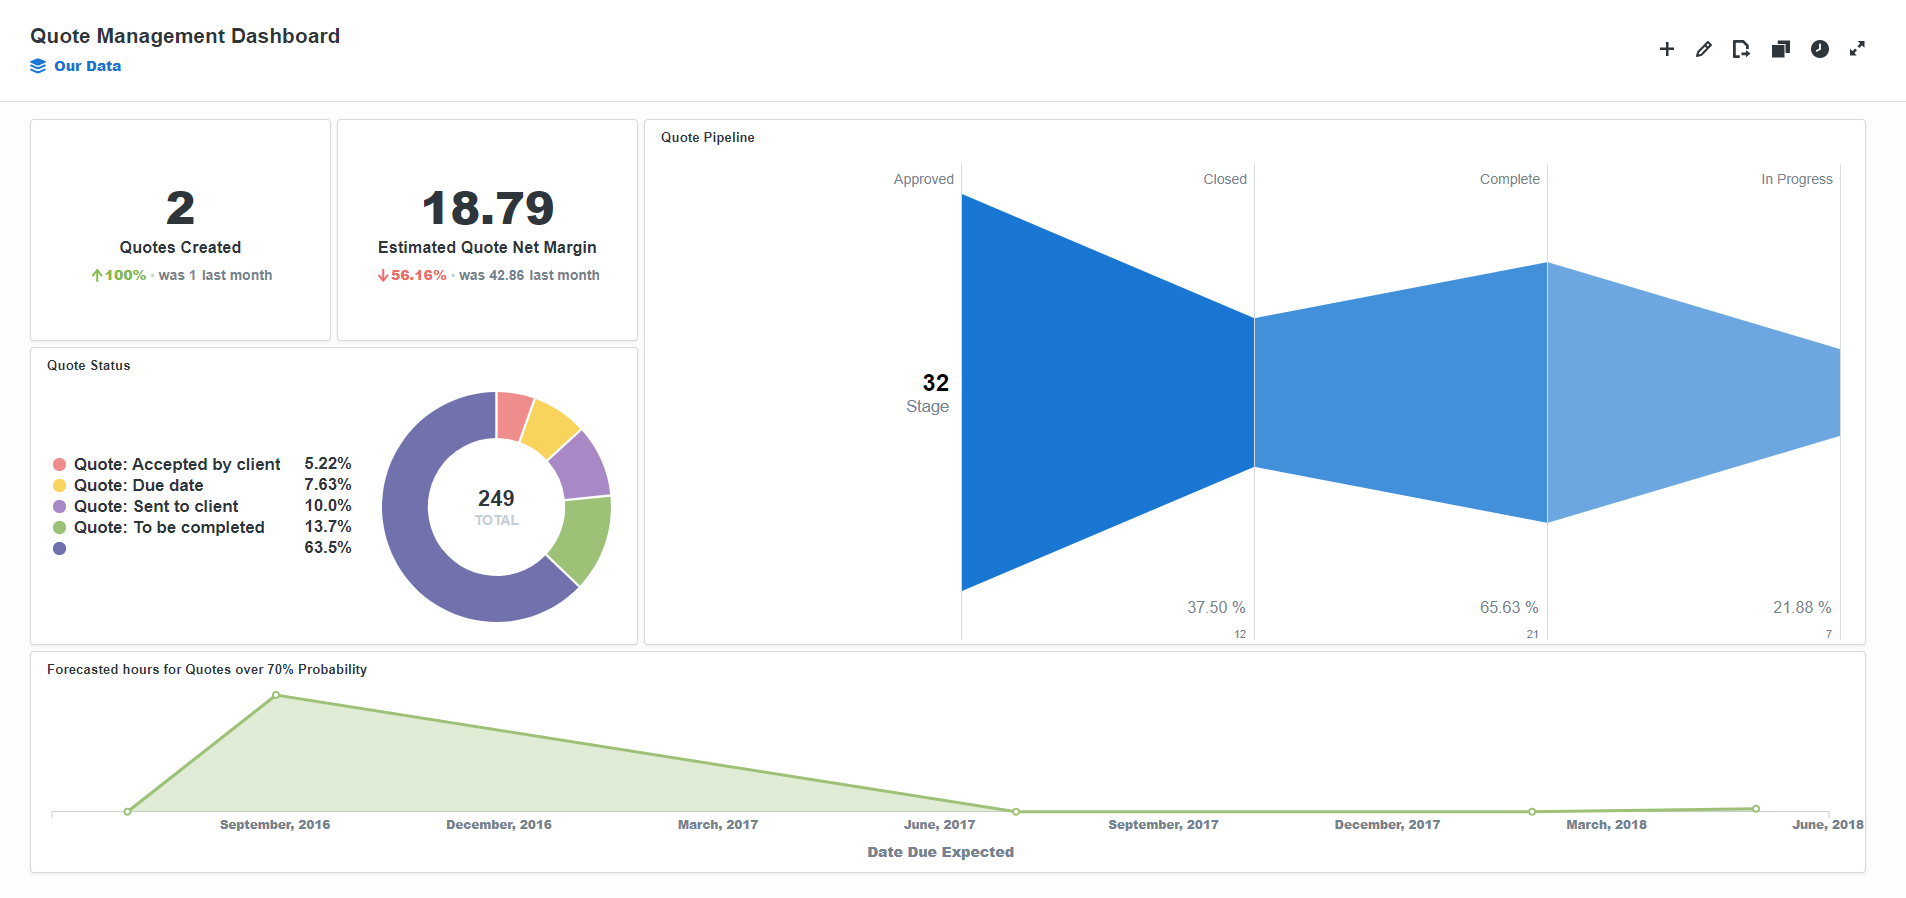
Example quote management dashboard
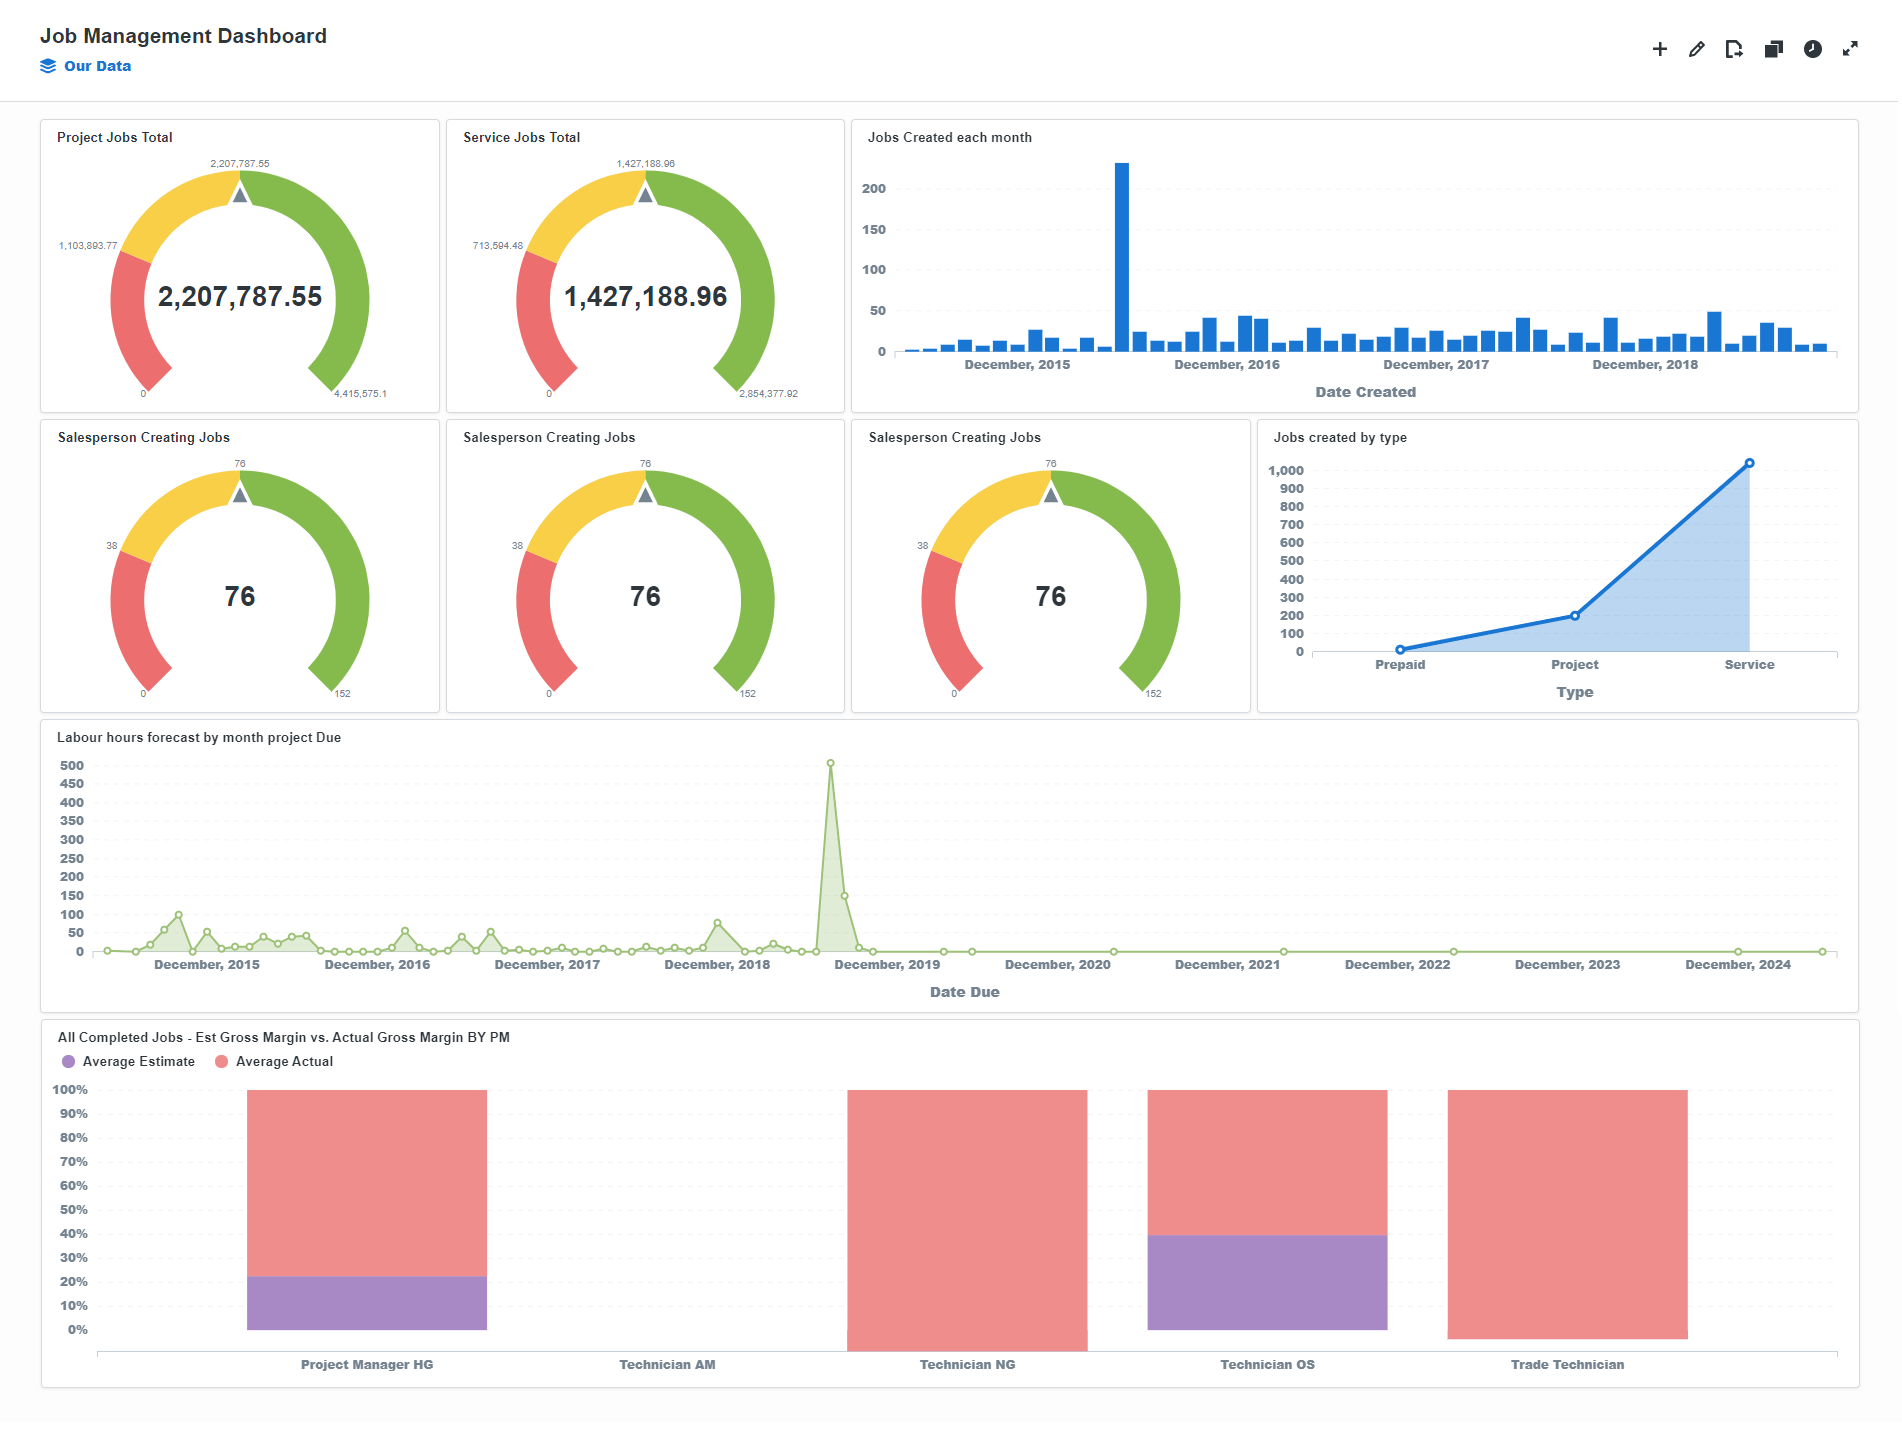
Example job management dashboard
 Learn more in the Learning Toolbox
For additional training, complete an interactive material in the Simpro's Learning Toolbox. Learn more in About Simpro's Learning Toolbox.
