Last Updated: December 08 2025
Overview
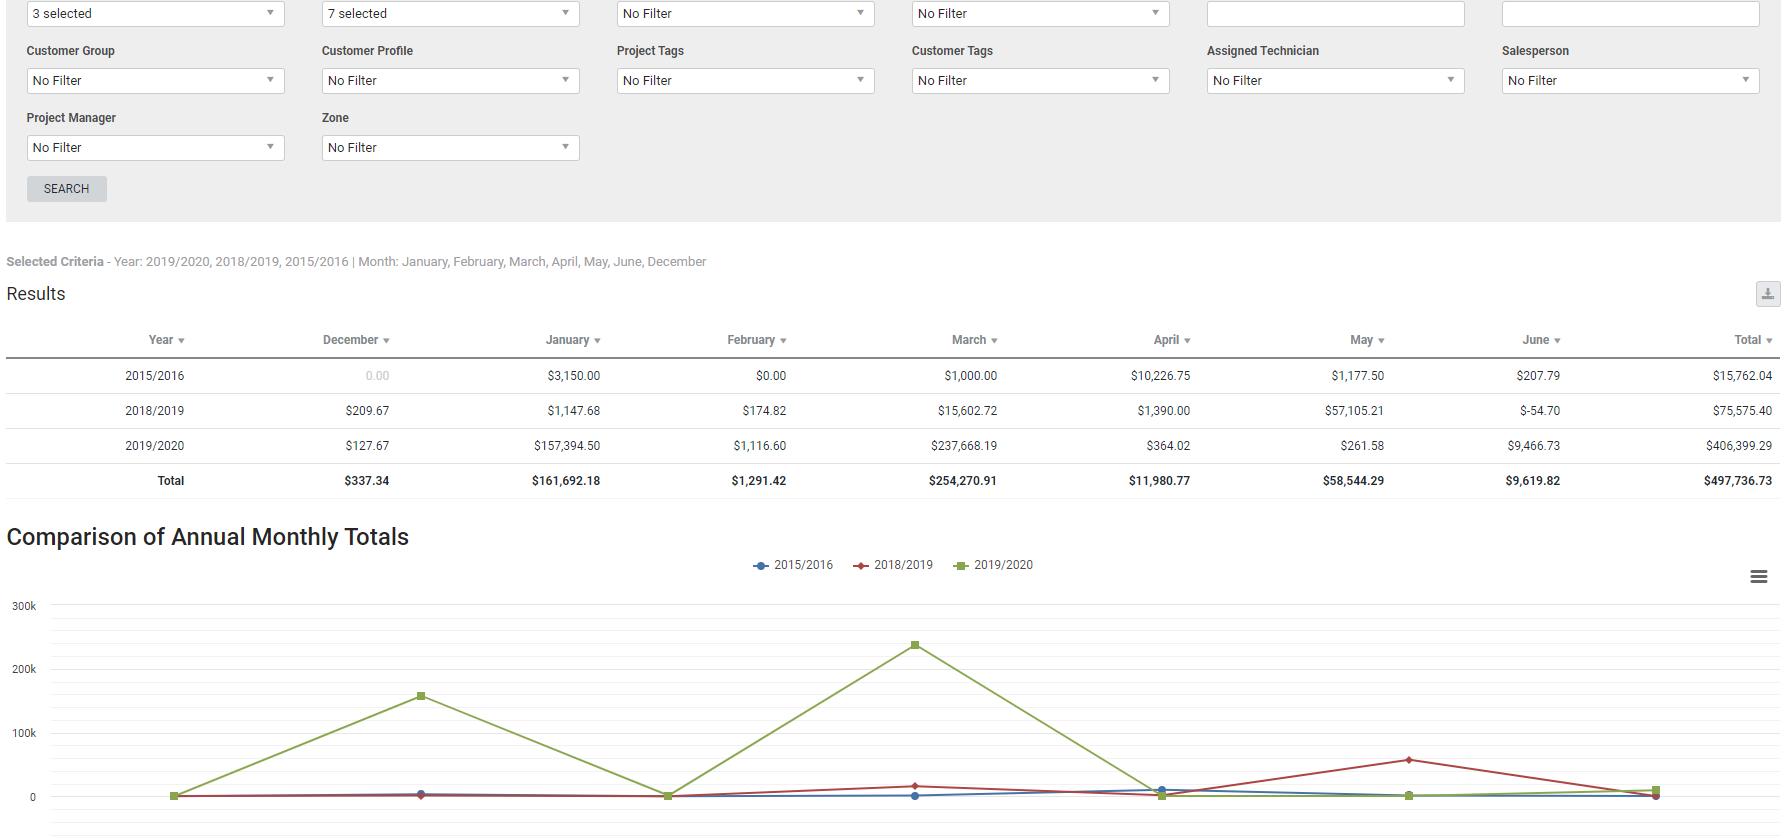
This report compares annual turnover based on invoiced amounts, and is useful for managers and business owners.
You can view a graphical representation of the yearly turnover below the report.
Learn about other Turnover reports in Turnover Reports.
 Required setup
In order to view content or perform actions referred to in this article you need to have the appropriate permissions enabled in your security group. Go to System![]() > Setup > Security Groups and access your security group to update your permissions. The relevant security group tab and specific permissions for this article can be found here:
> Setup > Security Groups and access your security group to update your permissions. The relevant security group tab and specific permissions for this article can be found here:
 Run the Annual Turnover report
To view the report:
- Go to Reports
 > View Reports.
 - Click Turnover > Annual Turnover.
- Select the financial years (the starting month of the financial year is determined in Financial Defaults) from the Year drop-down.
- Select one or more months from the Month drop-down to view only those specific months.
- Select to filter according to specific Business Groups, or a specific Cost Centre, Site, Customer Group, or Customer Profile.
- Select to filter according to specific Project Tags and Customer Tags.
- Select to filter according to the Assigned Technician, Salesperson, Project Manager or Zone.
- Click Search.
The report displays the results in a table, two line graphs and two bar graphs:
| Comparison of Annual Monthly Totals | This line graph displays the selected months' totals for each selected year. This gives an overview of increases and decreases of income throughout the year. |
| Comparison of Cumulative Annual Totals | This line graph displays income accumulating with each selected month for the selected years. |
| Comparison of Annual Totals | This bar graph displays the combined total of all months for each selected year. This allows you to compare the total income of years as a whole. |
| Comparison of Monthly Totals | This bar graph displays the combined monthly totals of all the selected years for each selected month. This gives an overview of which months have consistently higher totals. |
 Download the report as a CSV file
You can download the information in the report as a spreadsheet in CSV format, viewable in Microsoft Excel and other spreadsheet software.
To download the report:
- Generate the report as required.
- Click the
 icon in the top right, then click CSV.
 - View, print or save the CSV, as required.
 Download or print report charts
To download any of the charts, click the list icon in the top right and select an option.
