Last Updated: December 08 2025
Overview
In BI Reporting you can create custom reports as per your requirements. This article provides some example reports and how to create them. Go to Reports > BI Reporting > Ask question > New question.
Learn more in How to Create Questions.
Each report listed below indicates which options you should select in the DATA, FILTERED BY, VIEW and GROUPED BY fields. Once you select these fields, click Get Answer. The report is initially represented in a tabular format.
Click Table and select the required VISUALIZATION to represent the report in the recommended format as described in the examples below.
Note that all of these reports are samples designed with a view to provide a correct launching point to create custom reports based on your requirements. You can use these examples and adjust them to suit your business needs.
 Required setup
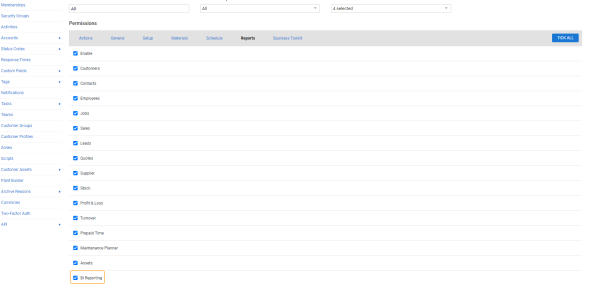
In order to view content or perform actions referred to in this article you need to have the appropriate permissions enabled in your security group. Go to System![]() > Setup > Security Groups and access your security group to update your permissions. The relevant security group tab and specific permissions for this article can be found here:
> Setup > Security Groups and access your security group to update your permissions. The relevant security group tab and specific permissions for this article can be found here:
 Security group permissions
If you have a multi-company Simpro Premium build, BI Reporting extracts data from all companies associated with the build.
In a multi-company build, users with permission to access BI Reporting can access data for all companies, regardless of other security group permissions.
To use BI Reporting, enable it in your security groups:
- Go to System
 > Setup > Security Groups.
 - Click the relevant security group.
- Click the Reports tab.
- Select the BI Reporting check box.
- Click Save and Finish.
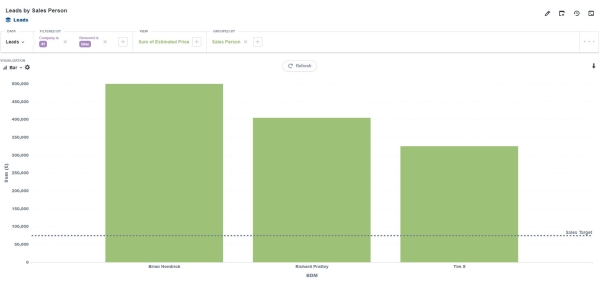
 Leads by sales person
DATA: Select Leads
FILTERED BY: Select Removed > select False > click Add filter
VIEW: Select Sum of > Estimated Price
GROUPED BY: Select Sales Person
VISUALIZATION: Select Bar
Leads by customer groups
You can also set to report leads by customer groups.
DATA: Select Leads
FILTERED BY: Select Removed > False > click Add filter
VIEW: Select Sum of > Estimated Price
GROUPED BY: Expand Customer > select Group Name
VISUALIZATION: Select Row Chart
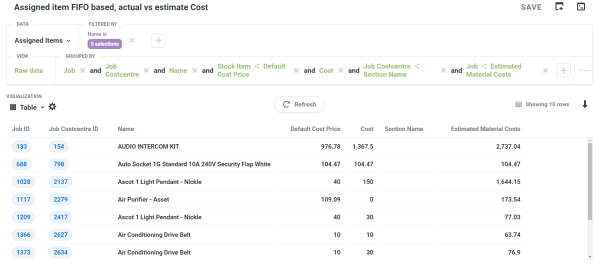
 Assigned item FIFO based, actual vs estimate cost
DATA: Select Assigned Items
FILTERED BY: Name > select Is > search for and select the item names
VIEW: Raw data
GROUPED BY: Job > Cost centre > Name
Expand Stock Item > Default Cost Price > Don't bin
Select Cost > Don't bin
Expand Job Cost Centre > Section Name
Expand Job > Estimated Material Cost > Don't bin
VISUALIZATION: Select Table
 Learn more in the Learning Toolbox
For additional training, complete an interactive material in the Simpro's Learning Toolbox. Learn more in About Simpro's Learning Toolbox.
