Last Updated: December 08 2025
Overview
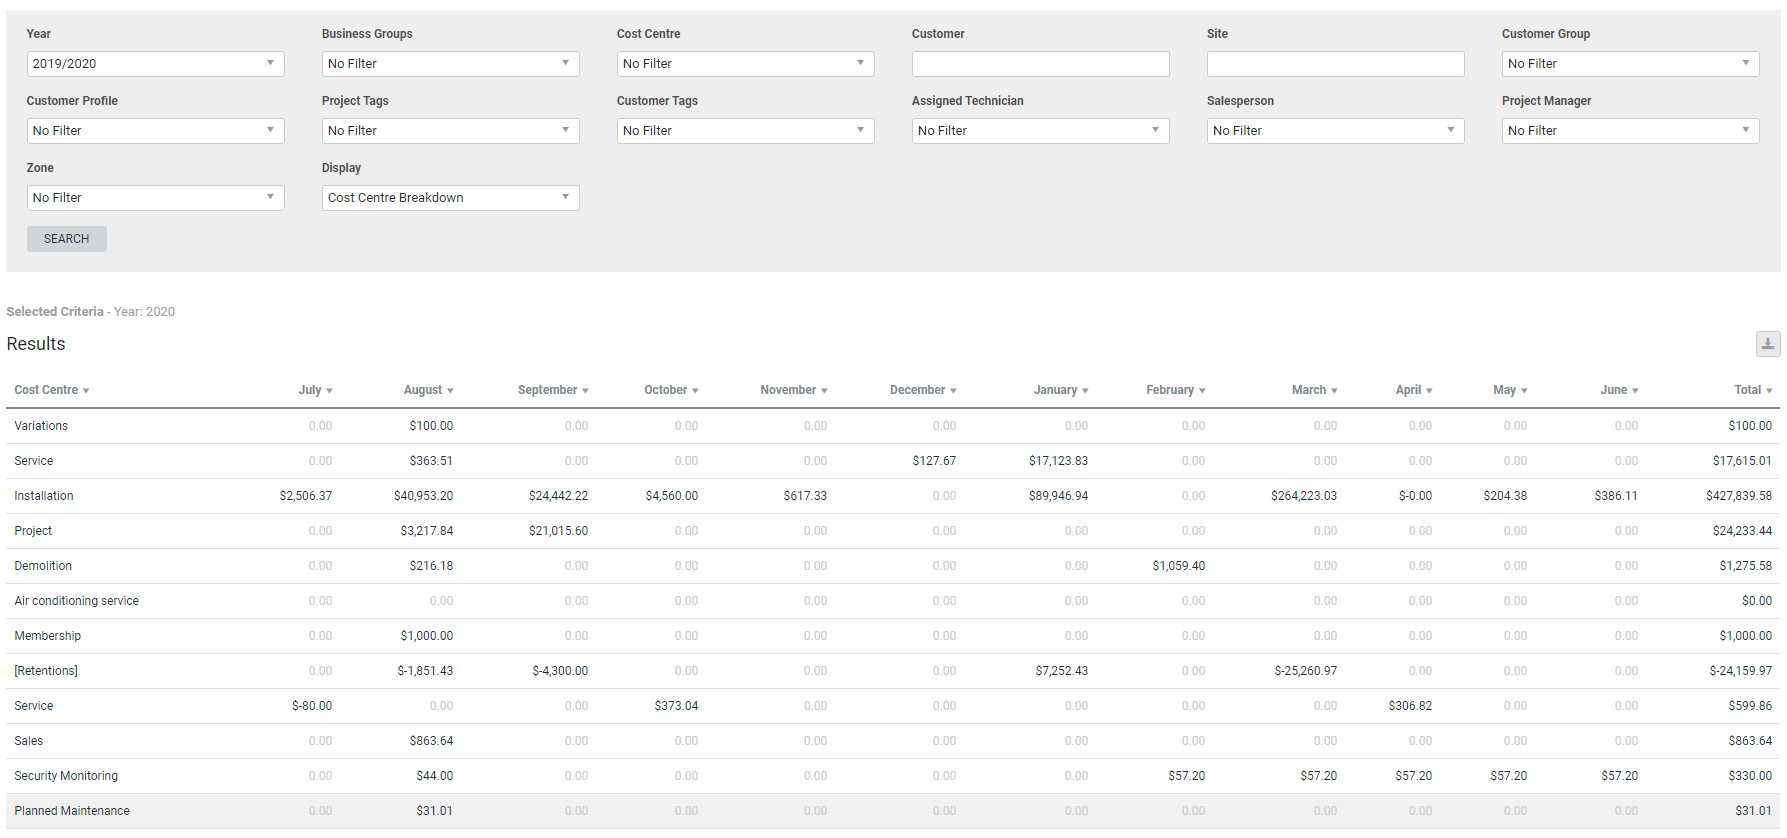
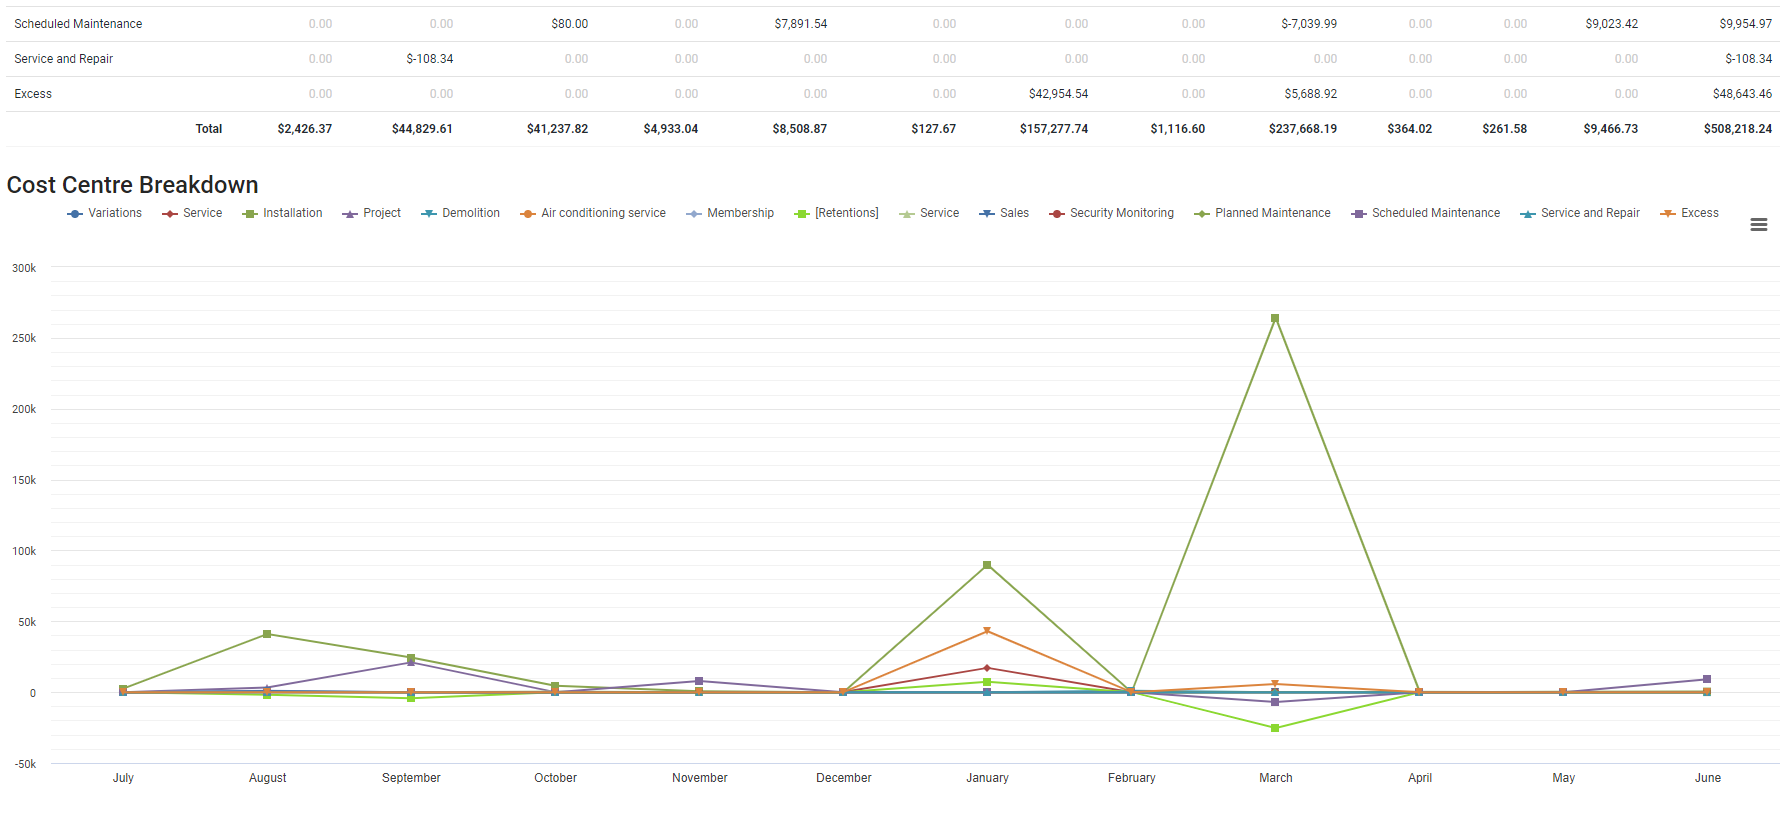
This report compares monthly turnover for each cost centre based on invoiced amounts, and is useful for managers and business owners to analyse turnover from a sales perspective, and have visibility of where income is coming from. You can view a graphical representation of the monthly turnover below the report in the Cost Centre Breakdown.
To track the growth of your business according to turnover over several years, go to Reports ![]() > View Reports > Turnover > Annual Turnover to generate the Annual Turnover report.
> View Reports > Turnover > Annual Turnover to generate the Annual Turnover report.
Learn about other Turnover reports in Turnover Reports.
 Required setup
In order to view content or perform actions referred to in this article you need to have the appropriate permissions enabled in your security group. Go to System![]() > Setup > Security Groups and access your security group to update your permissions. The relevant security group tab and specific permissions for this article can be found here:
> Setup > Security Groups and access your security group to update your permissions. The relevant security group tab and specific permissions for this article can be found here:
 Run the Monthly Breakdown report
To view the Monthly Breakdown report:
- Go to Reports
 > View Reports > Monthly Breakdown.
- Alternatively, go to Reports
 > View Reports > Turnover > Monthly Breakdown.
- Alternatively, go to Reports
- Select the financial Year.
- This is defined by the Start of Financial Year set in your Financial Defaults.
- Under Display, select:
- Cost Centre Breakdown to view the monthly turnover for each cost centre in both the Results table and Cost Centre Breakdown chart.
- Show Monthly Totals to view the monthly turnover for all cost centres combined.
- Select other filter options as required.
- Click Search.
In the Retention row of the generated report, values that were still being withheld are negative, while claimed values are positive.
US only: If you use Simpro Premium in the United States, the term 'retainage' is used instead of 'retention'.
 Filters
| Company | Multi-company only. Select the company to report on. Learn more in Multi-Company. |
| Year | Select the financial year for the report. Available years are based on the financial year set up in Financial Defaults. Learn more in How to Set Up Financial Defaults. |
| Business Groups | Select a business group to include projects for all cost centres belonging to that group. |
| Cost Centre | Select a cost centre to include jobs with that cost centre. |
| Customer | Search for a specific customer or contract to include jobs for that customer or contract. |
| Site | Search for a site to include jobs for that site. |
| Customer Group | Select a customer group to include jobs for customers belonging to that group. |
| Customer Profile | Select a customer profile to include jobs for customers with that profile. |
| Project Tags | Select a project tag to include jobs with that tag. |
| Customer Tags | Select a customer tag to include jobs for customers with that tag. |
| Assigned Technician | Select an employee or contractor to include jobs with that employee / contractor as the assigned technician. |
| Salesperson | Select a salesperson to include jobs with that salesperson. |
| Project Manager | Select a project manager to include jobs with that project manager. |
| Zone | Select a zone to include jobs for that zone. |
| Display |
Select:
|
 Columns
If Cost Centre Breakdown was selected, then monthly totals by separated by cost centre are displayed in the table. If Show Monthly Totals was selected, then combined monthly totals are displayed.
The last column is calculated by adding individual monthly values to give a total.
 View the Cost Centre Breakdown chart
You can view a graphical representation of the monthly turnover below the generated report in the Cost Centre Breakdown. Each dot on a line in the graphic represents the month. When you hover over the dot, you can view the month, cost centre name, and turnover for the cost centre in that month.
To remove a cost centre from the breakdown, click the applicable cost centre name above the graphic.
To print or download the Cost Centre Breakdown chart that appears below the report:
- Generate the report as normal.
- Click the list icon in the top right of the Cost Centre Breakdown chart.
- Click Print chart.
- Alternatively, select to download the chart as a PNG, JPEG, PDF, or SVG vector image.
 Download the report as a CSV file
You can download the information in the report as a spreadsheet in CSV format, viewable in Microsoft Excel and other spreadsheet software.
To download the report:
- Generate the report as required.
- Click the
 icon in the top right, then click CSV.
 - View, print or save the CSV, as required.

