Last Updated: December 08 2025
Overview
![]()
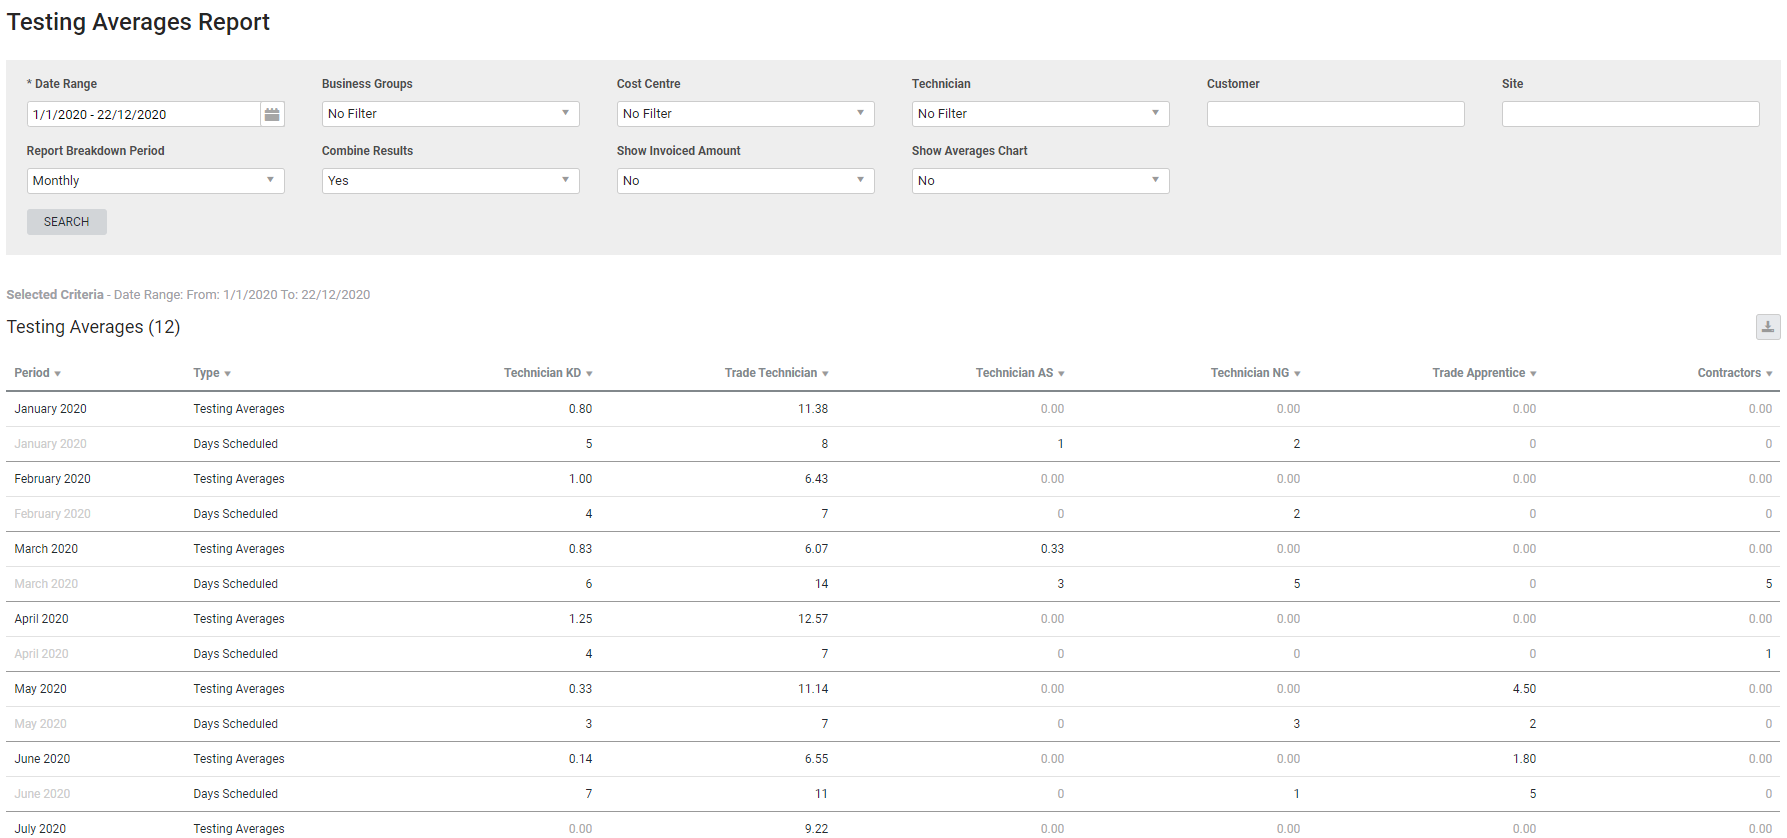
This report displays testing averages per employee, that is, the number of assets the employee tested over the number of days scheduled per week / month depending on the filters selected.
For example, if a technician worked three days in one week, and tested 30 assets during those days, the report would display a testing average of 10 assets per day for that particular week.
Learn more in How to Test Assets.
Learn about other Maintenance Planner reports in Maintenance Reports.
 Required setup
In order to view content or perform actions referred to in this article you need to have the appropriate permissions enabled in your security group. Go to System![]() > Setup > Security Groups and access your security group to update your permissions. The relevant security group tab and specific permissions for this article can be found here:
> Setup > Security Groups and access your security group to update your permissions. The relevant security group tab and specific permissions for this article can be found here:
 Run the Testing Averages report
To run the report:
- Go to Reports
 > View Reports.
 - Click Maintenance Planner > Testing Averages.
- Select the Date Range.
- Filter the report further by selecting from the Business Groups, Cost Centre and Technician drop-downs.
- If required, search and select a specific Customer or Site.
- Under Report Breakdown Period, select Monthly to see averages by the month or select Weekly to see averages by the week.
- Under Combine Results:
- Select No if you want the report to display separate tables for Testing Averages, Days Worked and Amounts Invoiced. You can download these as CSV files separately.
- Select Yes if you want to see all of these results as one table.
- Under Show Invoiced Amount, select Yes if you want to see the amounts invoiced on the technicians' scheduled jobs. This displays as an extra row or a separate table depending on if you have combined your results.
- Under Show Averages Chart, select if you wish to see the results as a graph as well as in the table.
- Click Search.
 Filters
You can use the following filters in the report:
| Date Range | Select a date range to include tests completed within that range. |
| Business Groups | Select a business group to include jobs with cost centres belonging to that business group. |
| Cost Centre | Select a cost centre to view jobs with that cost centre. |
| Technician | Select a technician to include tests completed by that technician. |
| Customer | Search for a specific customer to include jobs for that customer. |
| Site | Search for a specific site to include jobs for that site. |
| Report Breakdown Period | Select if testing averages are calculated based on weekly or monthly periods. |
| Combine Results |
Select:
|
| Show Invoiced Amount | Select Yes to display an additional table / row showing the amount invoiced on jobs where the employee is scheduled. |
| Show Averages Chart | Select Yes to display a chart as a visual representation of testing averages. |
 Download the report as a CSV file
You can download the information in the report as a spreadsheet in CSV format, viewable in Microsoft Excel and other spreadsheet software.
To download the report:
- Generate the report as required.
- Click the
 icon in the top right, then click CSV.
 - View, print or save the CSV, as required.
 Print or download graph
Click the list icon above the bar graph to Print, Download PNG image, Download JPEG image, Download PDF document or Download SVG vector image.
