Last Updated: January 05 2026
Overview
Use BI Reporting to extract specific data from your Simpro Premium build so you can create your own customised reports, dashboards and data visualisations to make more informed business decisions.
BI Reporting pulls data from a saved copy of your database, ensuring that the processing of information is efficient even when retrieving thousands of records. Depending on when the BI Reporting is being used, information presented in the reports can be up to 24 hours old.
You must be logged in to Simpro Premium to display data from BI Reporting.
If BI Reporting is not accessed in your build for more than 90 days it will become temporarily unavailable. When you attempt to access BI Reporting after this period, it will automatically reactivate the next time it syncs, which is typically occurs within 24 hours.
Also, since BI Reporting extracts information from a saved database and Simpro Premium's pre-generated reports extract information from live data, data records may vary when you cross reference similar reports.
Find out how to create some example reports in BI Reporting Examples.
 Required setup
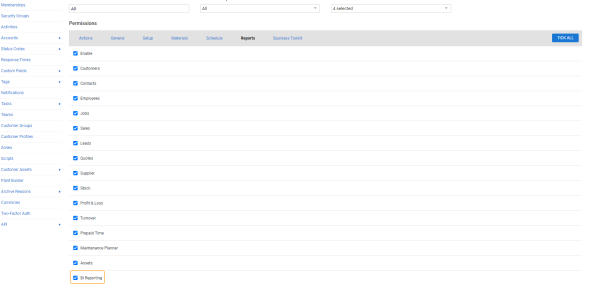
In order to view content or perform actions referred to in this article you need to have the appropriate permissions enabled in your security group. Go to System![]() > Setup > Security Groups and access your security group to update your permissions. The relevant security group tab and specific permissions for this article can be found here:
> Setup > Security Groups and access your security group to update your permissions. The relevant security group tab and specific permissions for this article can be found here:
 Security group permissions
If you have a multi-company Simpro Premium build, BI Reporting extracts data from all companies associated with the build.
In a multi-company build, users with permission to access BI Reporting can access data for all companies, regardless of other security group permissions.
To use BI Reporting, enable it in your security groups:
- Go to System
 > Setup > Security Groups.
 - Click the relevant security group.
- Click the Reports tab.
- Select the BI Reporting check box.
- Click Save and Finish.
 Access and navigate
To access the BI Reporting user interface, go to Reports ![]() > BI Reporting.
> BI Reporting.
As BI Reporting opens in a new tab, you need to allow pop-ups from Simpro Premium in your browser.
From the BI Reporting Home page click + New to create a Question, SQL query, Dashboard, Collection or Model.
The sidebar is expanded by default on the BI Reporting Home page. To access the sidebar anywhere else in BI Reporting hover over ![]() and click
and click ![]() . From the side bar you can access:
. From the side bar you can access:
- The Home screen of BI Reporting
- Bookmarked collections and questions, models, SQL queries and dashboards
- Your personal collection of questions, models, SQL queries, and dashboards, only accessible to the logged in user
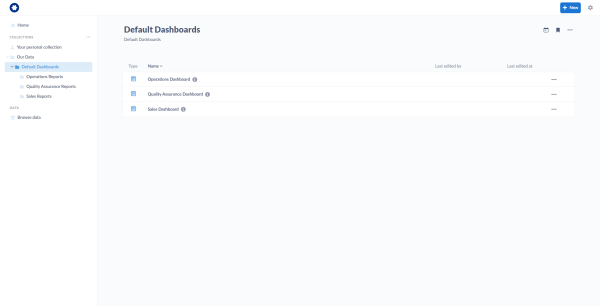
- Our Data, which contains your Simpro Premium build’s shared collection of questions, models, SQL queries, and dashboards
- Select the Default Dashboards folder under Our Data to view a list of Default Dashboards. You can select from multiple different preset dashboards, such as Operations Dashboards, Quality Assurance Dashboards and Sales Dashboards to build your customised dashboard, as required.
- Browse data, which displays an overview of all the tables you can pull data from to create questions. Click on a table to display it including all data that it contains.
 Collections
Questions, Models, SQL queries, and Dashboards are organised into Collections. Create a New collection to group similar questions and dashboards for easy reference.
To create a New collection:
- Click + New.
- Click Collection.
- Enter a Name and Description to help identify the collection.
- Select a Collection it's saved in to contain the collection in either your personal data, or the shared data accessible by everyone that uses your Simpro Premium build.
- Click Create.
Under COLLECTIONS click ![]() to create a New collection or View archive of collections.
to create a New collection or View archive of collections.
Open a collection to access the following options:
- Click
 to Bookmark a collection so that it appears at the top of your collections in the sidebar.
 - Click
 within a collection on the right side of the screen and click:
- Move to make a personal collection shared with all of Our Data or move a collection under another collection.
- Archive to remove the collection from your list.
Individual questions, dashboards, SQL queries, and models are displayed in a table within collections. The table displays the following information:
- Type provides a symbol to indicate whether the data is a question, dashboard, SQL query or model and if it is a question what kind of chart it is visualised with. Hover over the symbol and select the check box which appears to Archive or Move multiple items at once.
- Name of the data. Click on the name to open and edit the question, dashboard, SQL query or model.
- Who the data was Last edited by
- When the data was Last edited at
Click ![]() on a question, dashboard SQL query, or model to access the following options:
on a question, dashboard SQL query, or model to access the following options:
- Pin this, to display the data at the top of the collection
- Move the data to change it from private to shared or to another collection
- Archive the data
- Bookmark the data so that it appears at the top of your collections in the sidebar.
 Events and timelines
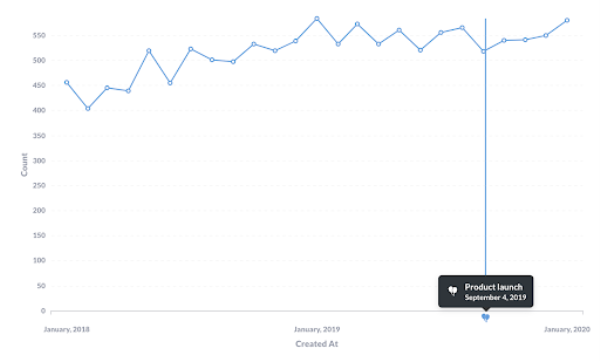
Events can be created for collections to account for important occurrences that might impact your data. When you create an event in a collection it becomes visible on all charts that are created within that collection. For example, you could create an event to record the launch of a new service, opening of a new branch or start of an important marketing campaign. This enables you to view if there is a large spike in your data, such as a large number of new jobs, or an increase in scheduled time that relates chronologically to these events.
Events are grouped in timelines so the events relating to one another can be marked with the same icon.
Note that events do not appear on dashboards.
To create a new timeline and event:
- In BI Reporting, navigate to the collection that you want the event to display in.
- Click
 .
. - Click Add an event.
- If there are no existing timelines, a new one is created when you add your first event.
- If you have already created events click on the relevant timeline.
- Click to create a New timeline or View archived timelines. To create a new timeline, enter a Name, Description and select a Default icon for the timeline. If you have the same icon for all events in a timeline it will help identify that they are connected when you view a chart.
- Enter the Event name that appears when you hover over the event in charts.
- Select the Date that the event should appear on charts.
- Enter the Description that appears when you click on the event in charts.
- Select the Icon that appears to identify the event in charts.
- Click Create.
Once an event is created click ![]() on an event to Edit event, Move event to different timelines or Archive event.
on an event to Edit event, Move event to different timelines or Archive event.
 Learn more in the Learning Toolbox
For additional training, complete an interactive material in the Simpro's Learning Toolbox. Learn more in About Simpro's Learning Toolbox.


