Last Updated: December 08 2025
Overview
![]()
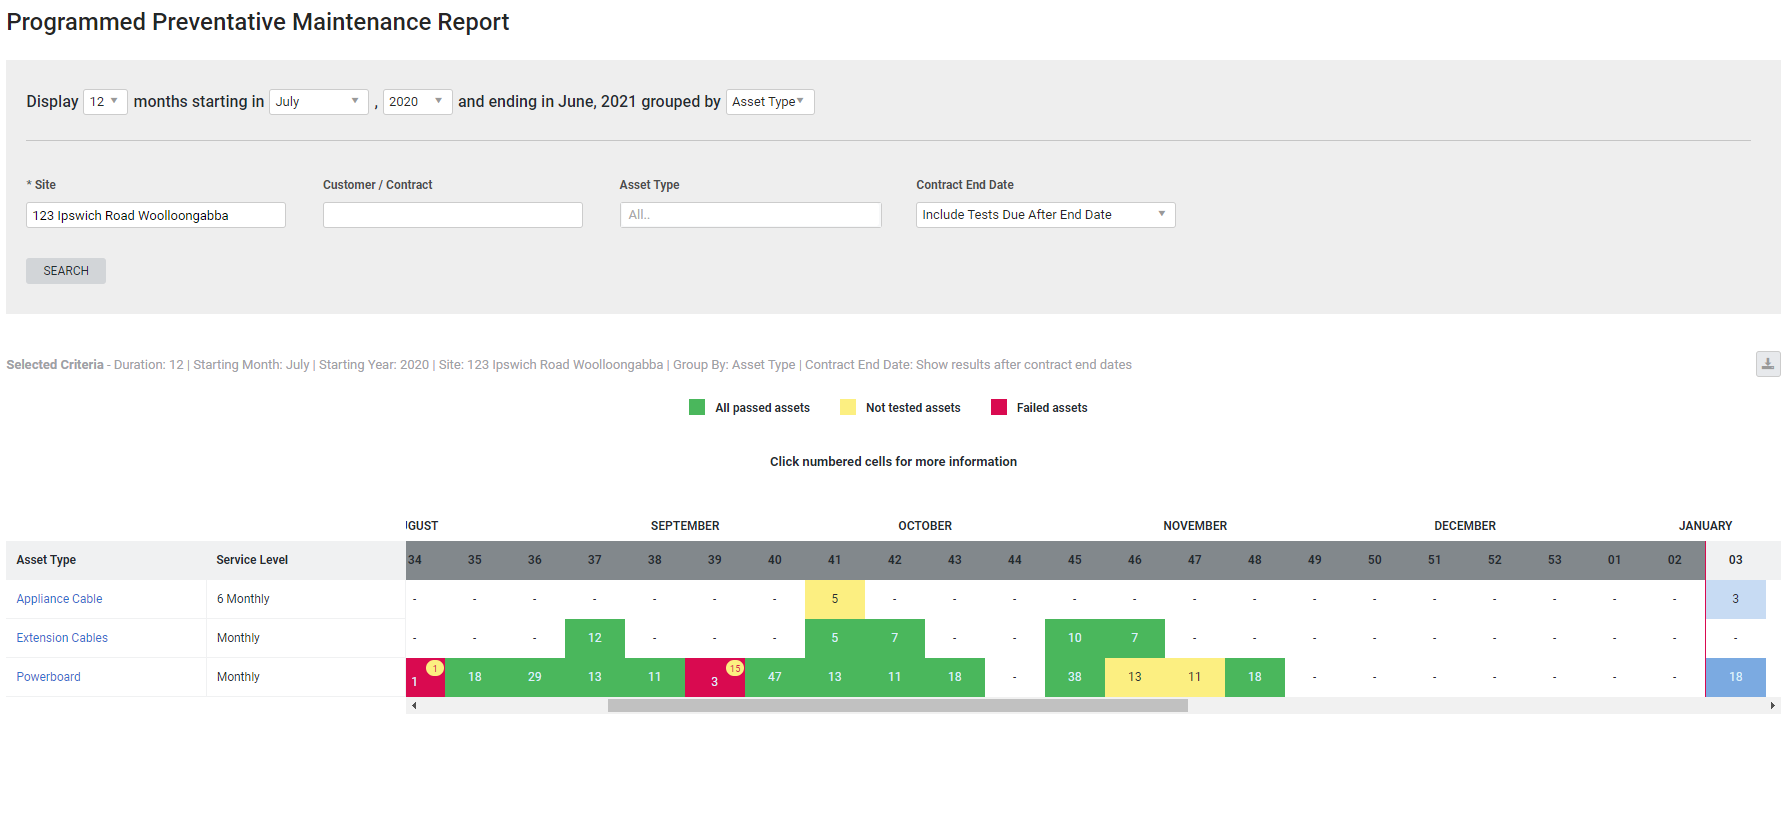
The Programmed Preventative Maintenance (PPM) report displays an overview of service results per service level and asset types.
You may wish to use this report as an annual service program matrix to examine pending and completed services against asset types for any service level within the specified site.
This report displays an overview of service results and the quantity of upcoming services per service level and asset types.
You can use this report to provide customers with an annual testing plan for specific sites.
This report can be exported as an image file so that your customers can receive a detailed representation of their asset testing plan. Alternatively, this report can also be accessed in the customer portal. Learn more in Customer Portal: Guide for Customers.
Learn about other Maintenance Planner reports in Maintenance Reports.
 Required setup
In order to view content or perform actions referred to in this article you need to have the appropriate permissions enabled in your security group. Go to System![]() > Setup > Security Groups and access your security group to update your permissions. The relevant security group tab and specific permissions for this article can be found here:
> Setup > Security Groups and access your security group to update your permissions. The relevant security group tab and specific permissions for this article can be found here:
 Run the Programmed Preventative Maintenance report
To view the report:
- Go to Reports
 > View Reports.
 - Click Maintenance Planner > Programmed Preventative Maintenance.
- Select the duration and date range using the number of months, starting month and year drop-downs.
- Select to group rows by Asset Type or Service Level.
- Search and select a Site.
- Select a Contract End Date:
- Include Tests Due After End Date displays the assets due to be tested in the period beyond the end date of the contract.
- Exclude Tests Due After End Date displays only the assets due to be tested up to the point of the contract end date.
- Search for and select a Customer, Contract, Asset Type and Service Level to filter the report.
- Click Search.
 Information displayed
The report divides the results based on weeks and each week runs from Monday to Sunday. Note the following to understand the report:
- Past results include all results tested prior to the current week. Future results include all results from the start of the current week. The current week is indicated by a red line.
- The Contract Expiry Date filter applies whether or not a contract is selected. If a contract is not selected, all assets are displayed and only those associated with contracts are displayed based on the filter option selected.
- Week 1 is the first complete week of January starting from Monday and ending on Sunday.
- Week 53 starts on the final Monday of December and includes the first days of the following year up to Sunday.
Click a cell with results to view:
- The start and end date of the week
- The asset type
- If the cell is for a future result, it displays the number of assets to be tested.
- If the cell is for a past result, it displays the number of assets not tested, failed and passed and the associated job number.
Past records
Past records show the quantity of assets that were tested that week. This is based on the date on the job card in which the assets were tested.
- If all asset tests due in that week have passed, the value shows the number of assets passed and the cell is green.
- If not all assets were tested but there were no failures, the number of assets not tested is displayed, and the cell is yellow.
- If there was at least one recorded failure, the number of failures is displayed and the cell is coloured red.
- If there was at least one recorded failure, but there were also some untested assets, the cell is red with a yellow bubble that displays the quantity of untested assets.
Future records
Future weeks show the number of assets due to be tested. This is based on the Service date, or if the asset is already added to a job, the due date on the job.
All future records are displayed blue.
Weeks that have a relatively higher number of assets due to be tested are displayed in a darker blue.
 Download the report as a CSV file
You can download the information in the report as a spreadsheet in CSV format, viewable in Microsoft Excel and other spreadsheet software.
To download the report:
- Generate the report as required.
- Click the
 icon in the top right, then click CSV.
 - View, print or save the CSV, as required.
