Last Updated: December 12 2025
Overview
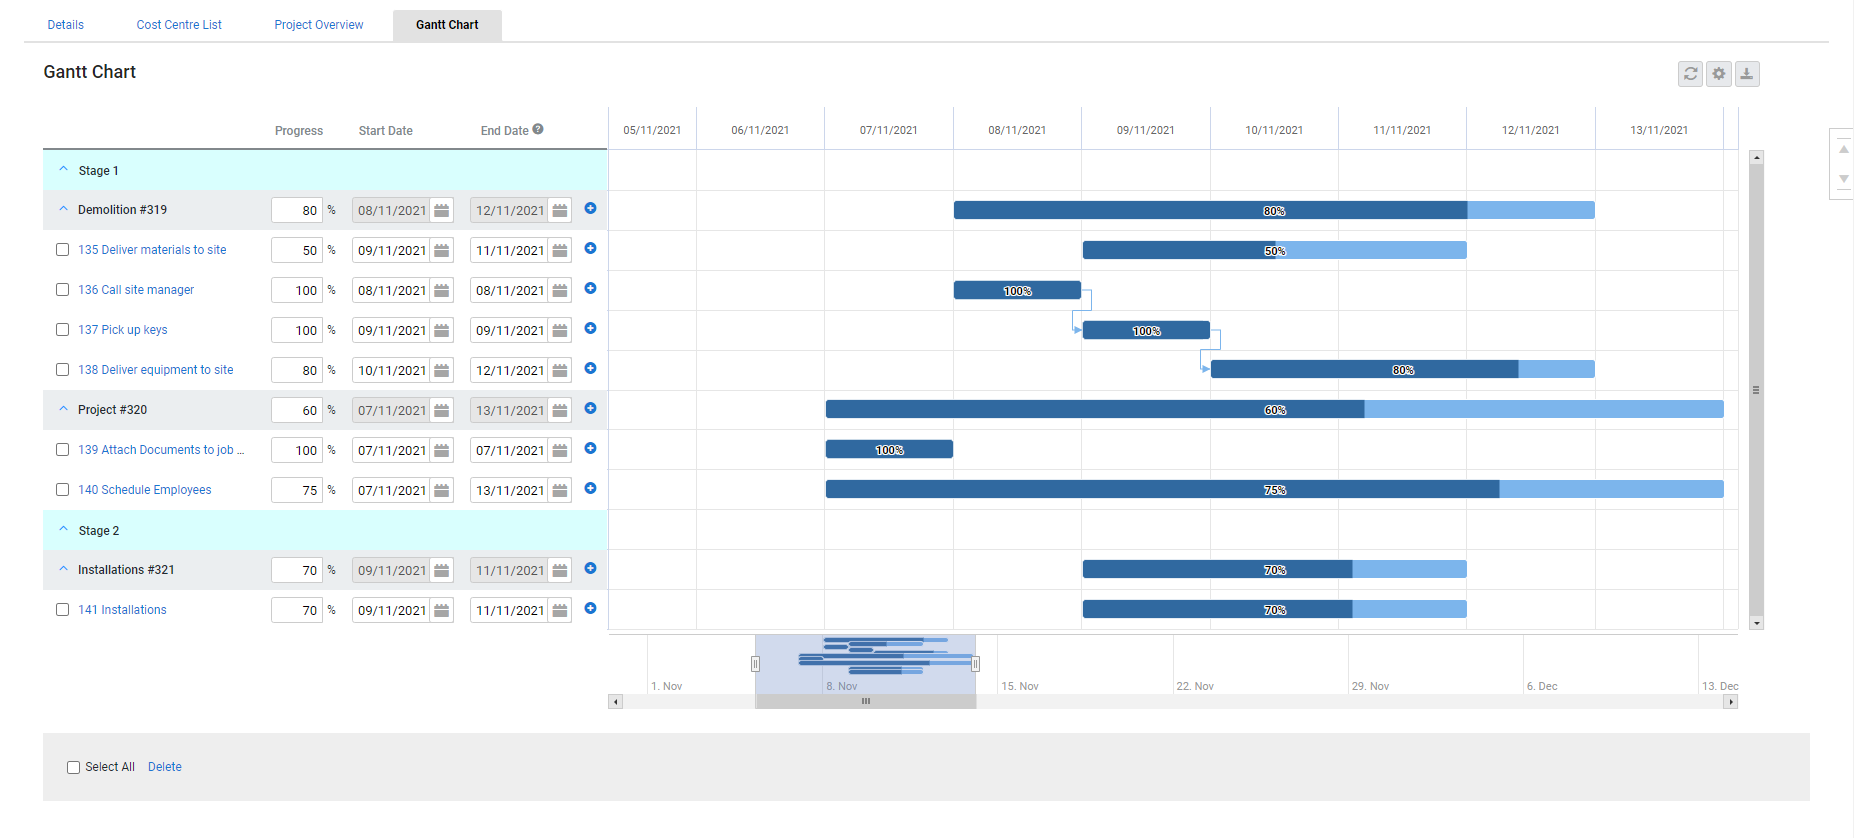
Use the Gantt Chart to manage and track the progress of all service and project quotes and jobs. The Gantt chart consists of a navigation pane, a timeline visualisation and rows for cost centres and tasks. In the Gantt Chart tab, you can view and update the progress of tasks and cost centres for the entire job and their corresponding Start Date and Completion Date.
Learn more in How to Use Tasks.
 Required setup
In order to view content or perform actions referred to in this article you need to have the appropriate permissions enabled in your security group. Go to System![]() > Setup > Security Groups and access your security group to update your permissions. The relevant security group tab and specific permissions for this article can be found here:
> Setup > Security Groups and access your security group to update your permissions. The relevant security group tab and specific permissions for this article can be found here:
 Navigate in Gantt Chart
To use the Gantt chart, make sure you have the security group permissions to edit quotes / jobs and there is at least one section / cost centre / task in the existing service or project quote / job.
Open the required quote / job and click the Gantt Chart tab. The Gantt view consists of two parts:
- The left panel lists the quote / job components: sections, cost centres, and tasks.
- The right panel is a timeline along with a navigation bar at the bottom.
Each job component has a separate row that extends onto the timeline to show the corresponding progress blocks. Use the drag handle on the navigation bar to adjust the start and end dates displayed on the Gantt timeline. A red-dotted vertical on the timeline indicates the current date.
On the Gantt timeline, you can:
- Hover over a progress block to view corresponding cost centre / task details.
- The dark blue portion of the progress block indicates the percentage completion of the corresponding cost centre / task.
- Select a progress block and drag to adjust the cost centre's / task's start and end dates.
- Filter tasks by category.
- Move and adjust all the linked task simultaneously.
The Gantt view navigation bar can extend to display seven empty days at start or end of the corresponding quote / job timeline. This allows users to extend the cost centre's / task's start or end dates in this available time frame.
 Use the Gantt Chart
To use the Gantt Chart:
- Open the required service or project quote / job.
- Go to the Gantt Chart tab.
- Use
 icon in the cost centre row to create new tasks, if required.
- To create a dependent task, click the
 icon in the task row.
- To create a dependent task, click the
- Enter the Progress for the cost centres and tasks as a percentage value.
- Select to enter the Start Date and Complete Date for each quote / job component.
- By default, the start and end date of a cost centre matches the start date of the first task and the end date of the final task in the cost centre.
- The End Date displayed on the Gantt chart, while the task is in progress, is based on the due date recorded inside the task.
- When the task status is marked as Closed, the End Date displayed on the Gantt chart is based on the Completed Date.
- When you create a task, the Start Date displayed on the Gantt chart is based on the start date recorded inside the task.
- If the cost centre’s start and end dates are not based on tasks, adjust the corresponding dates manually, if required.
- You can also adjust the length of the progress block on the timeline and modify the start and end dates.
- If any of the modified tasks are linked, the respective dependent or prerequisite tasks are also updated.
- Use the drag handle on the navigation bar to zoom in on a specific period in the timeline.
- Select individual tasks, or Select All to delete tasks in bulk.
- Click the
 icon to enable / disable:
- Email and update stakeholders. By default, the option Email task updates to stakeholders is not selected. This avoids email notifications being sent for each adjustment made to tasks from the Gantt Chart.
- Show task dependencies. Task links are displayed as blue arrows.
- Click the
 icon to refresh the Gantt chart with relevant changes.
 - Click the
 icon to download the chart as an Image or CSV.
 - Click Save and Finish to update the changes.
