Last Updated: December 15 2025
Overview
When you log in to Simpro Premium, you are taken to the dashboard, which provides an essential overview of your company's ongoing activity and information.
You can also select dashboard views to provide specific information, such as for sales and accounts, if enabled in your security group.
You can Return to the dashboard from anywhere in Simpro Premium.
 Required setup
In order to view content or perform actions referred to in this article you need to have the appropriate permissions enabled in your security group. Go to System![]() > Setup > Security Groups and access your security group to update your permissions. The relevant security group tab and specific permissions for this article can be found here:
> Setup > Security Groups and access your security group to update your permissions. The relevant security group tab and specific permissions for this article can be found here:
 Navigate from the dashboard using menus
You can navigate to all areas of Simpro Premium using the following menus:
These menus can be accessed from anywhere in Simpro Premium. Learn more in Navigate using menus.
 View alerts, announcements, and reminders
Above the Welcome banner on your dashboard view, you can view the following information:
| Alerts |
System alerts, which are not to be confused with notifications, appear here in the event of:
You can also view alerts by clicking the on the Alerts icon in the System menu. Learn more in How to View Alerts. |
| Announcements | New announcements from Simpro Premium appear here, and are typically information on the latest updates to the system. |
| Reminders | View scheduled or due follow-ups, tasks and leads, quotes, jobs, and activities. |
 Dashboard views
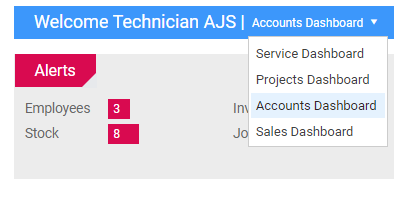
If your security group has more than one dashboard view assigned, click the drop-down arrow next to the Welcome banner to select a different view.
To learn how to enable access to the different dashboard views, see How to Set Up Security Groups.
 View the service dashboard
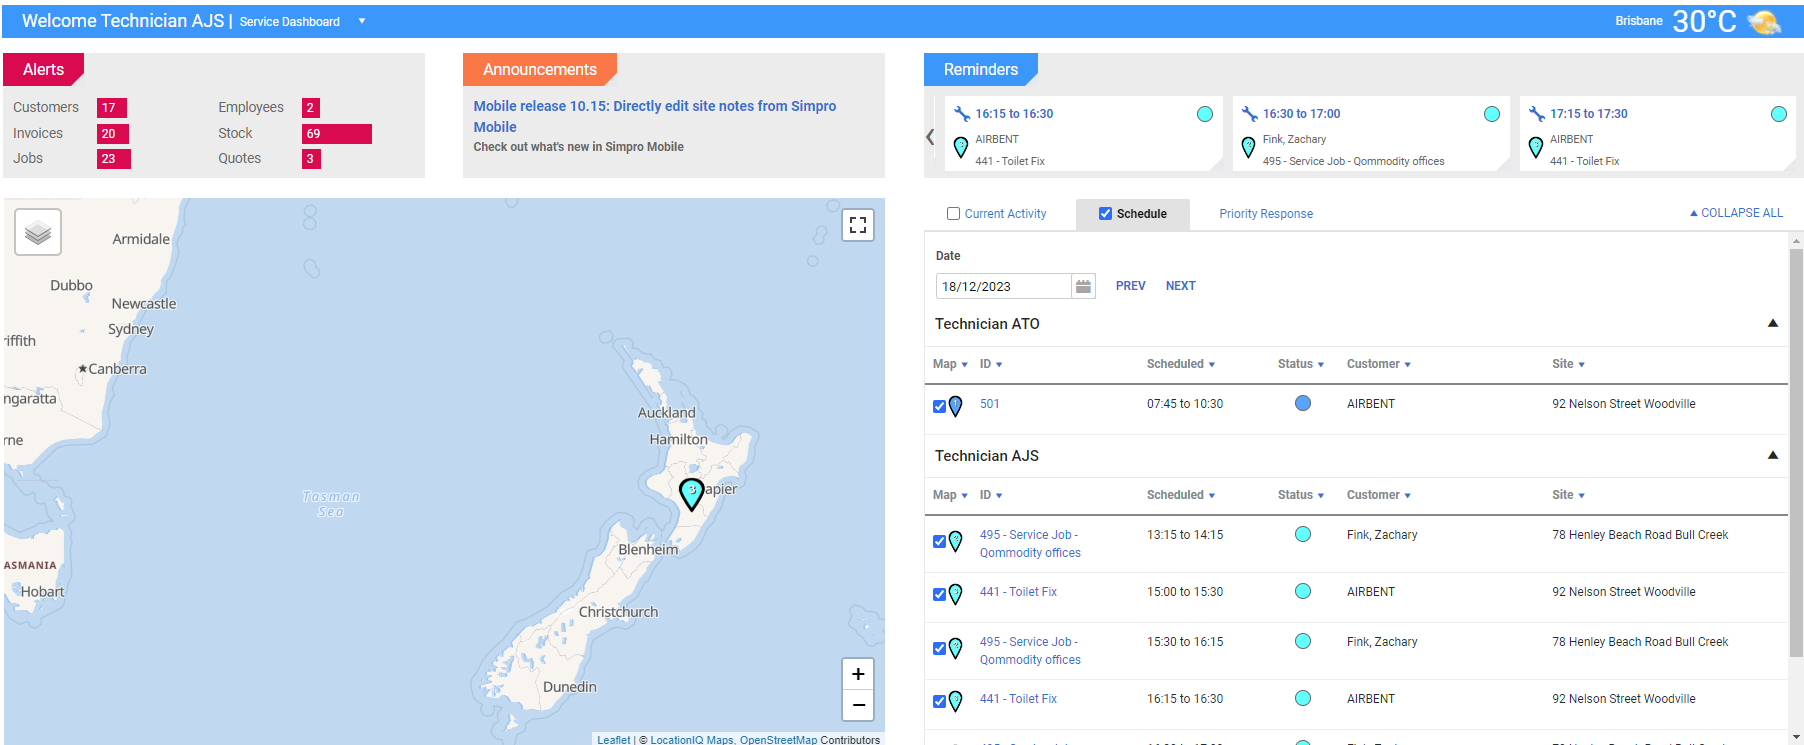
The service dashboard displays a map of today's scheduled quotes and jobs on the left and a list of the day's activities on the right.
The map displays pins for each job that is scheduled today and employee profile photos for technicians' current locations.
Click Schedule to view your upcoming list of jobs, including the job name, scheduled time, status, customer and site. You can choose specific date, or use the PREV and NEXT options to navigate, as required. Use the RESET TO TODAY option to return to the current day.
To hide a pin on the map, clear its check box. The most recently scheduled technician is listed at the top and each scheduled job is assigned a number accordingly. This allows you to easily see which employees are scheduled to the same job throughout the day.
Click Current Activity to view a list of the most recent mobile updates received from technician devices, including the cost centre, the employee who sent the update, the scheduled time, status, customer and site.
Jobs that are assigned response times appear in the Priority Response tab on the Service dashboard. For more information on dashboards, see How to Use the Simpro Premium Dashboard.
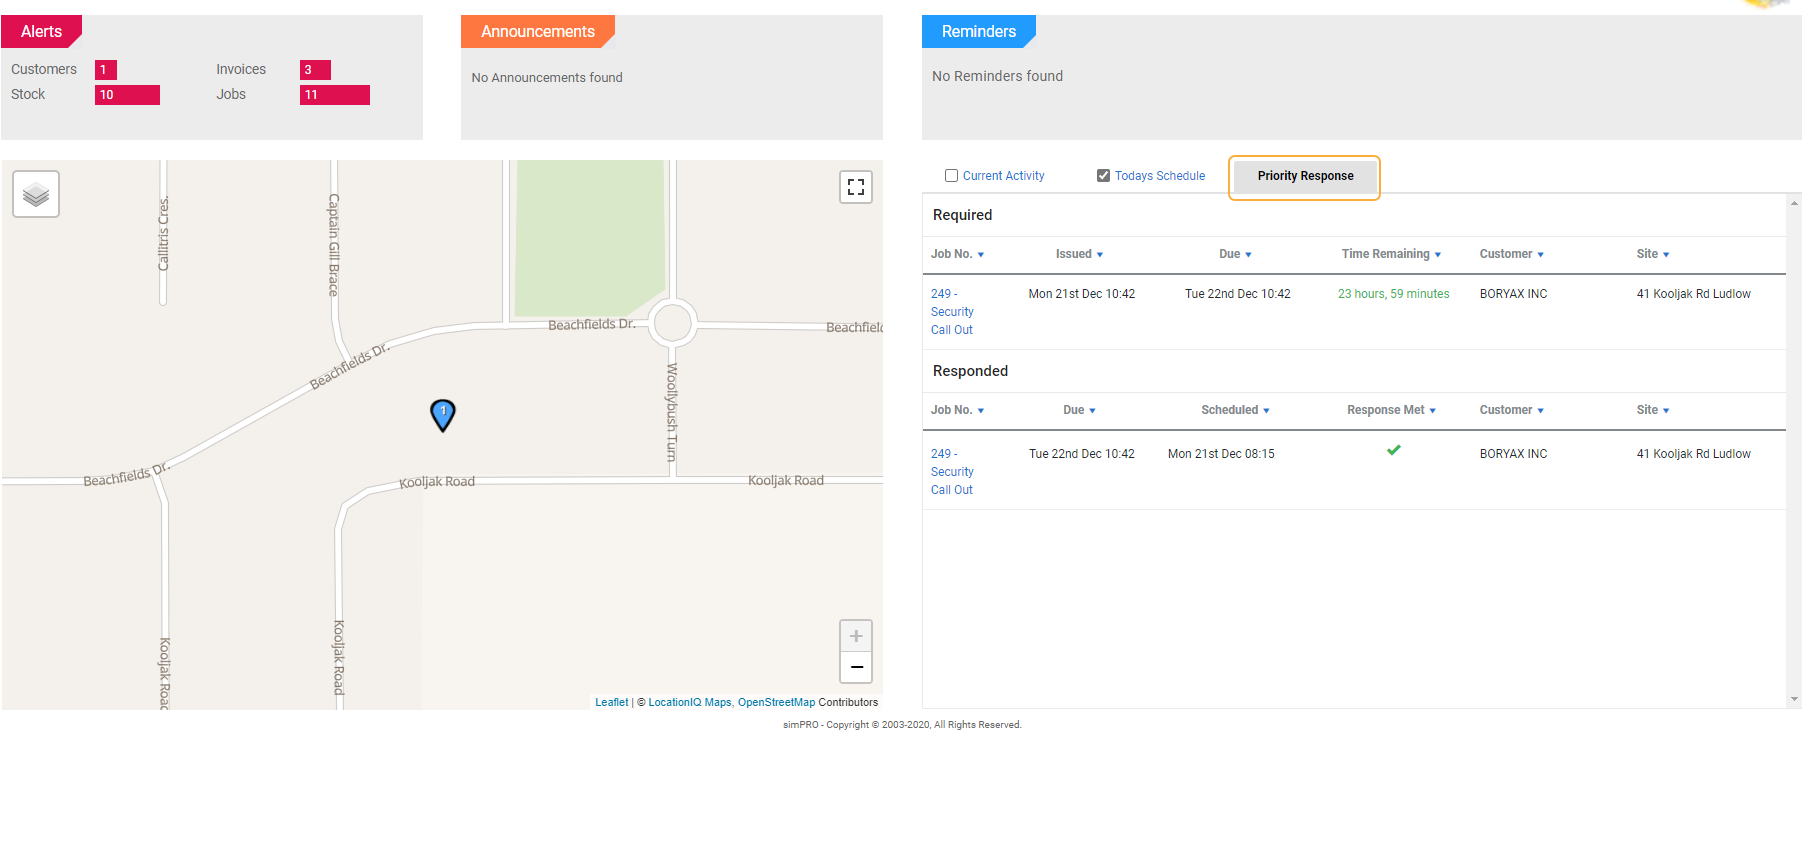
When you log in to Simpro Premium, click the drop-down arrow next to the Welcome banner to select the Service dashboard and click the Priority Responses tab. The information is classified into the following sections:
- Response Required: Lists the job number, date and time when the job was issued and is due, the Time Remaining until the due date, and the customer and site name. The Time Remaining is shown in green if the due date is not yet passed, alternatively it is shown in red.
- Response Scheduled: Lists the job number, date and time when the job was scheduled, whether the response was met, and the customer and site name.
The jobs in the Complete, Invoiced and Archived stages are not displayed on the Priority Responses tab. Also, the Priority Response tab does not appear on the Service dashboard if there are no jobs with response times pending or in progress.
Learn more in How to Use Response Times.
 View the projects dashboard
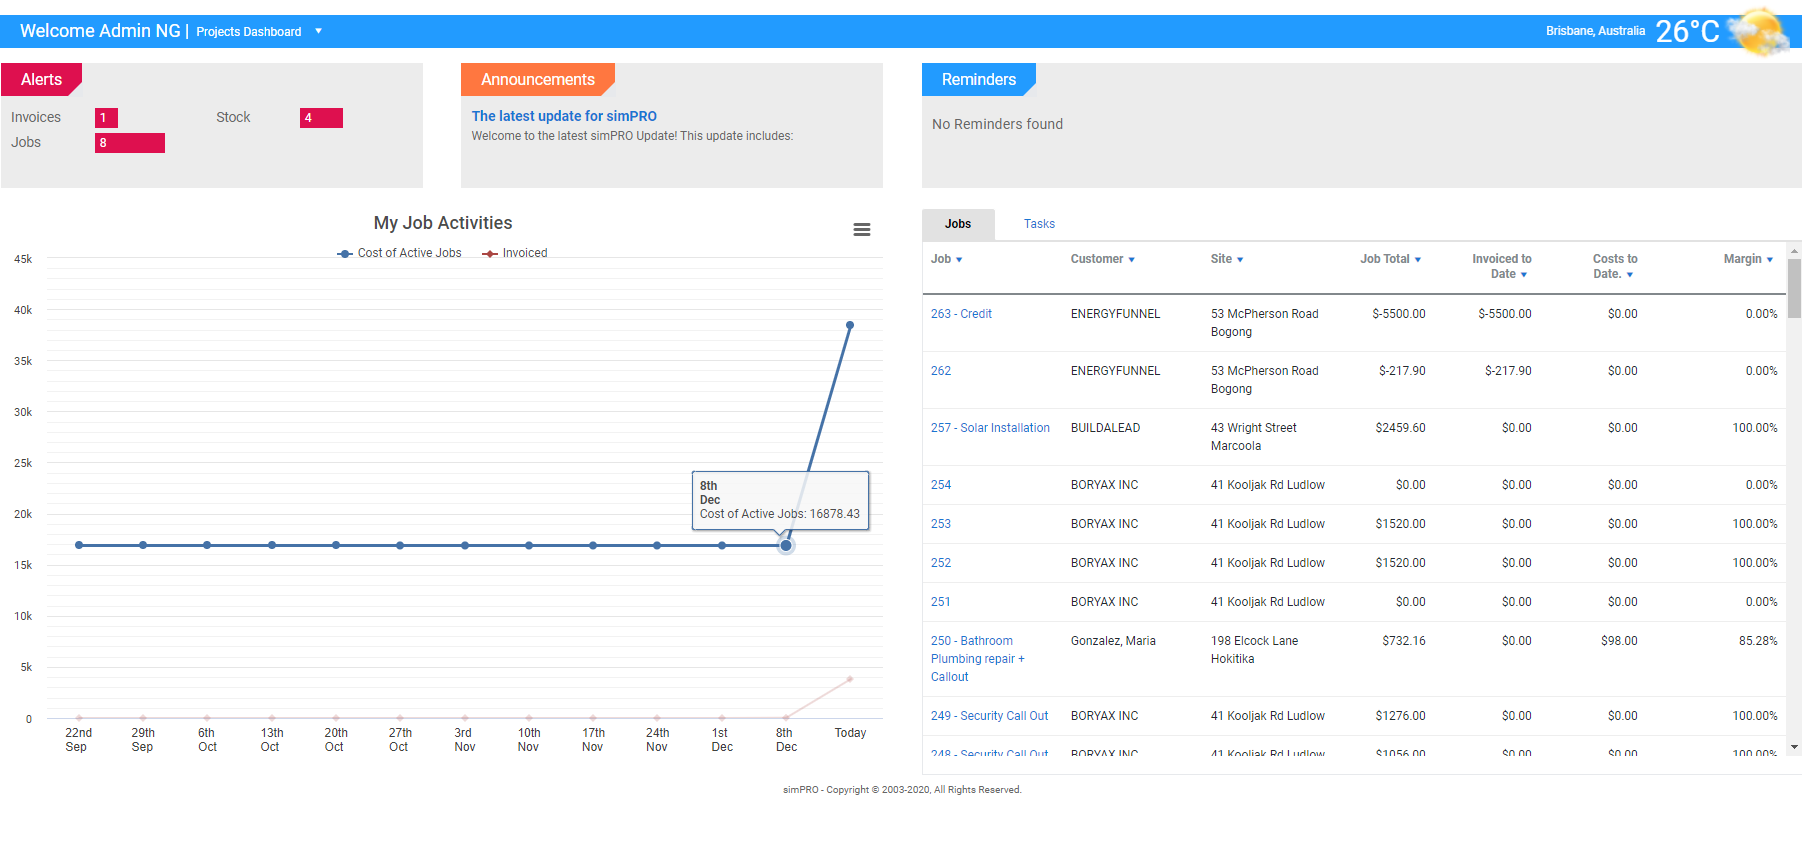
The projects dashboard displays a line graph that represents the labour and material costs of active jobs and invoiced amounts over the past 12 weeks.
Labour costs are applied to the graph when the schedule or contractor work order is created, while material costs are applied when the materials are assigned to an active job. Invoice values are applied to the graph when the invoice is issued. When a job is completed or archived, all values relating to that job are deducted from the graph values.
You can print or download the graph by clicking the list icon in the top right.
On the right you can view a list of active jobs that have you as the assigned Project Manager or Salesperson, or a list of active tasks that you are assigned to. If an employee is both a Salesperson and a Project Manager, they only see jobs they are assigned to as Project Manager. If the employee is a Salesperson and not a Project Manager, they see jobs they are assigned to as Salesperson.
Click Jobs to view job details including the job number, customer, site, job total, amount invoiced to date, costs to date and the margin as a percentage.
Click Tasks to view task details including the task number, subject, associated job number, customer, priority, status and due date.
 View the accounts dashboard
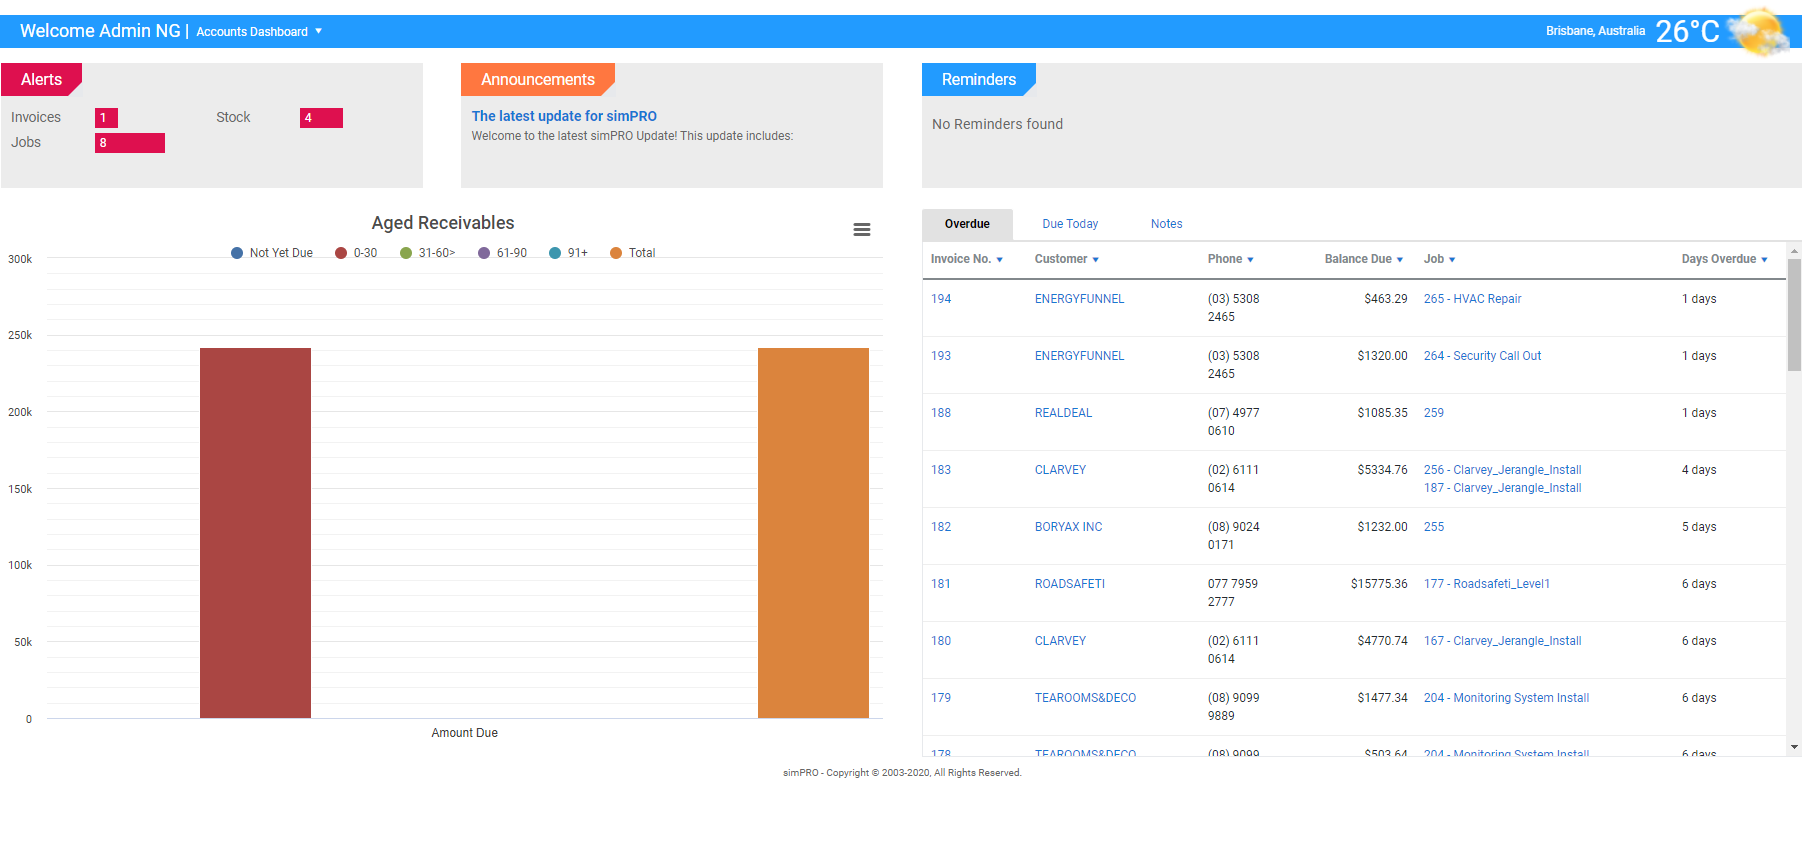
The accounts dashboard displays an Aged Receivables graph of overdue invoices on the left that includes bars for invoices not due yet, invoices overdue by 0-30 days, 31-60 days, 61-90 days, 91+ days, and the total amount due. Hover over the bars to view the exact figures. You can also print or download the graph by clicking the list icon in the top right.
Click Overdue to view a list of invoices, including the invoice number, customer, phone number, balance due, job number, and days overdue.
Click Due Today to view a list of invoices due today, including the invoice number, customer, contact, balance due, and job number.
Click Notes to view a list of notes in customer card files that are assigned to you and are due to be followed up.
Sort the lists by clicking the column headings or print or download the graph by clicking the list icon in the top right.
 View the sales dashboard
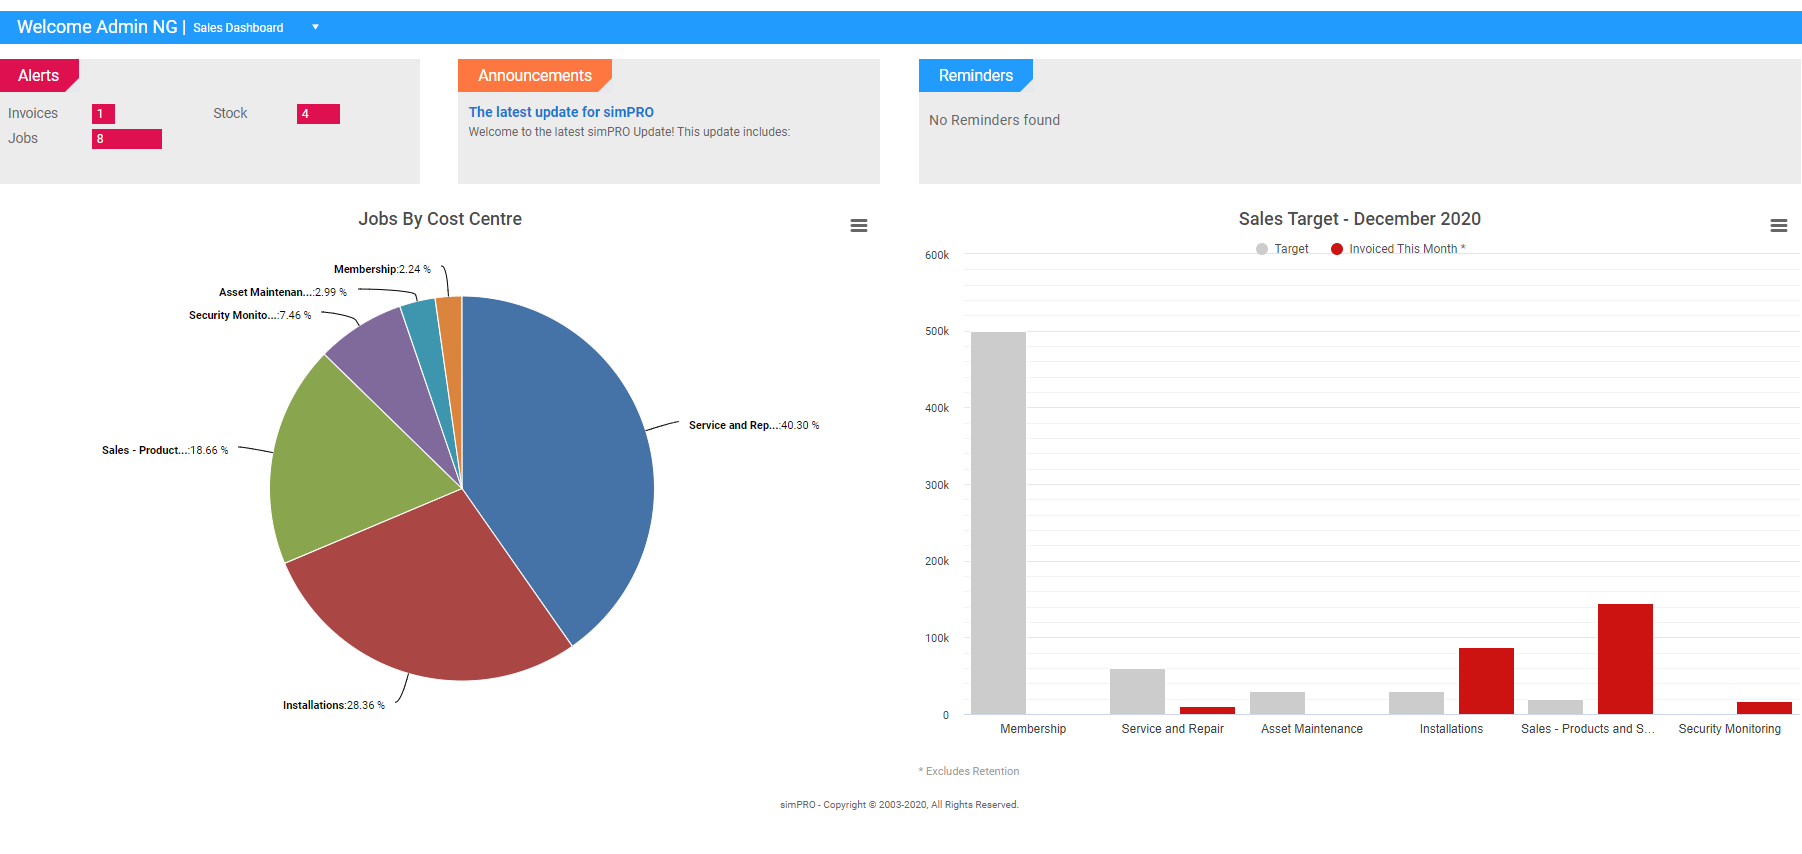
The sales dashboard displays a pie chart of jobs by cost centre on the left and a graph of monthly sales targets and total invoiced amounts on the right.
| Jobs by Cost Centre |
Each section of the pie chart represents a cost centre that has associated jobs. Hover over a section to see both the number and percentage of jobs. If a job has multiple cost centres, each of those cost centres are counted in the chart. The top cost centres with the highest number of jobs are displayed in the chart. If you have more than 12 cost centres, the cost centres that make up the top 80% of your sales are named, and the remaining 20% are labelled as Other. |
| Sales Target - (Month) |
The grey bars represent the monthly target budget for each cost centre excluding tax, while the red bars represent the total sum of all invoiced amounts for the current month for that cost centre, also excluding tax. To switch between the total view and the individual cost centre view, click a bar in the graph. Unapproved requests for claim are not included, but voided invoices are included in the calculations, which offset the original invoice if they are within the same month. |
You can print or download the graph by clicking the list icon in the top right.
 Return to the dashboard
To return to the dashboard from anywhere in Simpro Premium, click the Simpro Premium logo on the Dashboard in the top left above the main menu.
